
6. Working with 3D Options
3D Options / Box
Boxed
| The bounding box can be switched on or off. | In[1]:=
b = Graphics3D[Stellate[Dodecahedron[]], Boxed ->
False]; Show[b] In[2]:= JavaView[b] |
|
Compare with Mathematica |
BoxRatios
| BoxRatios is an option for Graphics3D and SurfaceGraphics which gives the ratios of side lengths for the bounding box of the three�dimensional picture. | In[1]:=
br = Graphics3D[Stellate[Dodecahedron[]],
BoxRatios -> {1., 2., 1.4}]; Show[br] In[2]:= JavaView[br] |
|
Compare with Mathematica |
FaceGrids
| FaceGrids is an option for three�dimensional graphics functions that specifies grid lines to draw on the faces of the bounding box. | In[1]:=
fg = Graphics3D[Stellate[Dodecahedron[]],
FaceGrids -> {{-1, 0, 0}, {1, 0, 0}}]; Show[fg] In[2]:= JavaView[fg] |
|
Compare with Mathematica |
AxesEdge
| AxesEdge is an option for three�dimensional graphics functions that specifies on which edges of the bounding box axes should be drawn. | In[1]:=
ae = Graphics3D[Stellate[Dodecahedron[]], Axes ->
True, AxesEdge -> {{-1, -1}, {-1, 1}, {1, 1}}]; Show[ae] In[2]:= JavaView[ae] |
|
Compare with Mathematica |
BoxStyle
| BoxStyle is an option for three�dimensional graphics functions which specifies how the bounding box should be rendered. | In[1]:=
bs = Graphics3D[Stellate[Dodecahedron[]], BoxStyle
-> {RGBColor[1, 0, 0], Dashing[{0.05, 0.05}]}]; Show[bs] In[2]:= JavaView[bs] |
|
Compare with Mathematica |
3D Options / Light
Lighting
| Lighting is a flag to disable the automatics lighting and use default coloring by height or apply a ColorFunction. | In[1]:=
plf = Plot3D[Sin[xy], {x, 0, 3Pi/2}, {y, 0,
3Pi/2}, Lighting -> False]; Show[plf] In[2]:= JavaView[plf] |
|
Compare with Mathematica |
LightSources
| LightSources is an option forGraphics3D and related functions that specifies the properties of point light sources for simulated illumination. | In[1]:=
ls = Graphics3D[Stellate[Dodecahedron[]],
LightSources -> {{{1., 0., 0.}, RGBColor[1., 0.4, 0.4]}, {{-.15, .85,
0.}, RGBColor[0.4, 1., 0.4]}, {{-.15, -.85, 0.}, RGBColor[0.4, 0.4,
1.]}}]; Show[ls] In[2]:= JavaView[ls] |
|
Compare with Mathematica |
AmbientLight
| AmbientLight is an option for Graphics3D and related functions that gives the level of simulated ambient illumination in a three�dimensional picture. | In[1]:=
al = Graphics3D[Stellate[Dodecahedron[]],
AmbientLight -> RGBColor[0., 0.3, 0.]]; Show[al] In[2]:= JavaView[al] |
|
Compare with Mathematica |
Shading
| Shading is an option that specifies whether the surfaces should be shaded. | In[1]:=
s = Graphics3D[ Stellate[Dodecahedron[]], Shading
-> False]; Show[s] In[2]:= JavaView[s] |
|
Compare with Mathematica |
3D Options / Mesh
This options are shown with a SurfaceGraphics object. Mathematica scales the surface automatically to box ratios x : y : z = 1 : 1 : 0.4 and clips very high and low z-values. JavaView shows the surface with the correct z coordinates, without automatic clipping so the surface looks different.
Mesh
| Mesh is an option for SurfaceGraphics and DensityGraphics that specifies whether an explicit x�y mesh should be drawn. | In[1]:=
nm = SurfaceGraphics[Table[Sin[x]*Exp[y], {x, -Pi,
Pi, Pi/4.}, {y, -E, E, E/4.}], Mesh -> False]; Show[nm] In[2]:= JavaView[nm] |
|
Compare with Mathematica |
MeshStyle
| MeshStyle is an option forPlot3D,DensityPlot and related functions which specifies how mesh lines should be rendered. | In[1]:=
ms = SurfaceGraphics[Table[Sin[x]*Exp[y], {x, -Pi,
Pi, Pi/4.}, {y, -E, E, E/4.}], MeshStyle -> {Thickness[0.01],
RGBColor[1., 0., 0.], Dashing[{0.02, 0.02}]}]; Show[ms] In[2]:= JavaView[ms] |
|
Compare with Mathematica |
MeshRange
| MeshRange is an option for ListPlot3D, SurfaceGraphics, ListContourPlot, ListDensityPlot and related functions which specifies the range of a and a coordinates that correspond to the array of a values given. | In[1]:=
mr = SurfaceGraphics[Table[Sin[x]*Exp[y], {x, -Pi,
Pi, Pi/4.}, {y, -E, E, E/4.}], MeshRange -> {{-Pi, Pi}, {-E, E}}, Axes
-> True]; Show[mr] In[2]:= JavaView[mr] |
|
Compare with Mathematica |
ClipFill
| ClipFill is an option for SurfaceGraphics that specifies how clipped parts of the surface are to be drawn. | In[1]:=
cf = SurfaceGraphics[Table[Sin[x]*Exp[y], {x, -Pi,
Pi, Pi/4.}, {y, -E, E, E/4.}], ClipFill -> {GrayLevel[0.],
GrayLevel[1.]}]; Show[cf] In[2]:= JavaView[cf] |
|
Compare with Mathematica |
Shading
See 3D Options / Light.
HiddenSurface
| HiddenSurface is an option for SurfaceGraphics which specifies whether faces are drawn. See also Shading. | In[1]:=
hs = SurfaceGraphics[Table[Sin[x]*Exp[y], {x, -Pi,
Pi, Pi/4.}, {y, -E, E, E/4.}], HiddenSurface -> False]; Show[hs] In[2]:= JavaView[hs] |
|
Compare with Mathematica |
3D Options / View
ViewPoint
| This option defines (in coordinates relative to the bounding box) the camera position. | In[1]:=
vp = Graphics3D[Stellate[Dodecahedron[]],
ViewPoint -> {3., 3., 1.}]; Show[vp] In[2]:= JavaView[vp] |
|
Compare with Mathematica |
ViewCenter
| The command ViewCenter modifies the interest of the camera. | In[1]:=
vc = Graphics3D[Stellate[Dodecahedron[]],
ViewCenter -> {1, 1, 1}]; Show[vc] In[2]:= JavaView[vc] |
|
Compare with Mathematica |
ViewVertical
| ViewVertical is an option for Graphics3D and SurfaceGraphics which specifies what direction in scaled coordinates should be vertical in the final image. | In[1]:=
vv = Graphics3D[Stellate[Dodecahedron[]],
ViewVertical -> {1., 1., 1.}]; Show[vv] In[2]:= JavaView[vv] |
|
Compare with Mathematica |
SphericalRegion
Shows no effect in JavaView. SphericalRegion is an option to scale the geometry inside the display such, that it could be rotated without exceeding the display size - this should be ever possible in JavaView.
PolygonIntersections
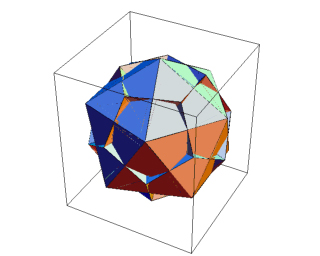
| PolygonIntersections is an
option for Graphics3D which specifies whether intersecting polygons
should be left unchanged. Note: because of the large size of the MGS file (1 MB) the right cell shows an image. Follow the comparison link to watch the applet. |
In[1]:=
pi = Show[Graphics3D[{Stellate[Dodecahedron[],
-0.5], Icosahedron[]}, PolygonIntersections -> False]]; Show[pi, PlotRagne-> All] In[2]:= JavaView[pi] |
 Compare with Mathematica |