ComputationalGeometry.
 |
 |
| JavaView Snapshot | Mathematica Snapshot |
| JavaView Applet | JavaView Lite Applet |
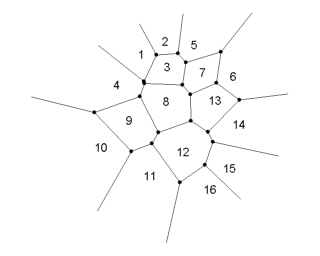
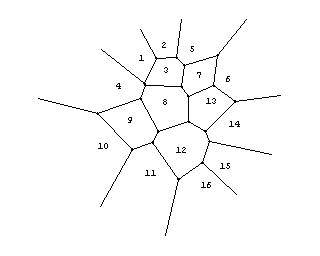
| Plot of the Voronoi diagram of given points. | In[1]:=
<<DiscreteMath`ComputationalGeometry` In[2]:= data2D = {{4.4, 14}, {6.7, 15.25}, {6.9, 12.8}, {2.1, 11.1}, {9.5, 14.9}, {13.2, 11.9}, {10.3, 12.3}, {6.8, 9.5}, {3.3, 7.7}, {0.6, 5.1}, {5.3, 2.4}, {8.45, 4.7}, {11.5, 9.6}, {13.8, 7.3}, {12.9, 3.1}, {11, 1.1}}; In[3]:= v = DiagramPlot[data2D]; In[4]:= JavaView[v] |
