
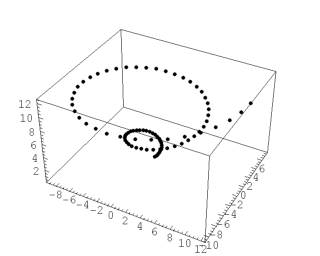
ScatterPlot3D.
 |
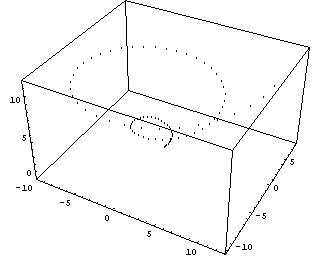 |
| JavaView Snapshot | Mathematica Snapshot |
| JavaView Applet | JavaView Lite Applet |
| Here is a list of points in three dimensions. The scatter plot of points lies on a conical helix. | In[1]:=
<<Graphics`Graphics3D` In[2]:= lpts = Table[{t Cos[t], t Sin[t], t}, {t, 0, 4Pi, Pi/20}]; In[3]:= sc = ScatterPlot3D[lpts] In[4]:= JavaView[sc] |