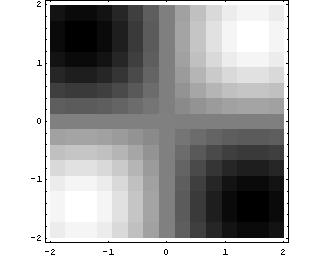
DensityPlot.
 |
 |
| JavaView Snapshot | Mathematica Snapshot |
| JavaView Applet | JavaView Lite Applet |
| Suppresses the grid lines. | In[1]:=
gdnm = DensityPlot[Sin[x] Sin[y], {x, -2, 2}, {y, -2, 2}, Mesh -> False] In[2]:= JavaView[gdnm] |

 |
 |
| JavaView Snapshot | Mathematica Snapshot |
| JavaView Applet | JavaView Lite Applet |
| Suppresses the grid lines. | In[1]:=
gdnm = DensityPlot[Sin[x] Sin[y], {x, -2, 2}, {y, -2, 2}, Mesh -> False] In[2]:= JavaView[gdnm] |
|
|