
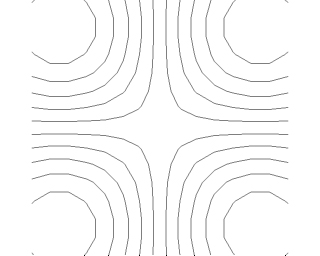
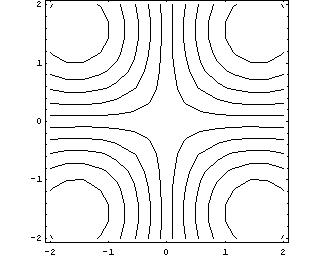
ContourPlot.
ContourPlot[] is used to produce level lines. The command generates a ContourGraphics[] objects containing a rectangular array of scalar values. The contour lines itself are produced in a subsequent Show[] command or by a conversion to a Graphics[] object. The command produces both flat faces and the level curves.
Before being passed to JavaView a ContourGraphics will be casted to Graphics in Mathematica. The received Graphics object consists of Lines[] as contour lines and of Polygons[] as level regions. The first polygon is a rectangle of GrayLevel 0.5 filling the whole display. It is followed by polygons in falling and ascending order of GrayLevel, each bright polygon is part of each darker polygon surrounding it down to GrayLevel 0.5, and each dark polygon is part of each brighter polygon surrounding it up to GrayLevel 0.5.
 |
 |
| JavaView Snapshot | Mathematica Snapshot |
| JavaView Applet | JavaView Lite Applet |
| Switches off the shading avoids the problem of overlapping faces in JavaView. |
In[1]:=
gcns = ContourPlot[Sin[x] Sin[y], {x, -2, 2}, {y, -2,
2}, ContourShading -> False]
In[2]:= JavaView[gcns] |